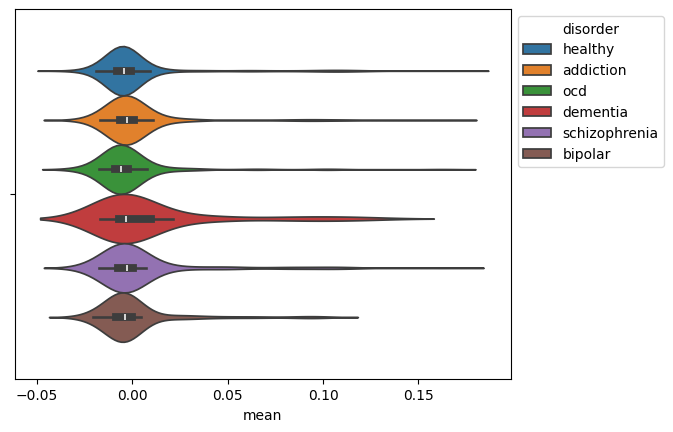
# Average EEG signal across various disorders
This tutorial demonstrates how to compute and visualize the average
EEG signal across various disorders using `mne`, `pandas`, and
`seaborn` in conjunction with `almirah`.
## Setup
First, we'll import the necessary libraries and set the log level for MNE.
```python
import mne
import pandas as pd
import seaborn as sns
from almirah import Dataset
mne.set_log_level(False)
```
## Loading the Dataset
Next, we'll load the dataset and query the EEG files.
```python
ds = Dataset(name="calm-brain")
eeg_header_files = ds.query(datatype="eeg", task="rest", extension=".vhdr")
eeg_data_files = ds.query(datatype="eeg", task="rest", extension=".eeg")
len(eeg_data_files)
```
This should give the total number of EEG files:
1120
We then download the EEG data files.
```python
for file in eeg_data_files:
file.download()
```
## Querying the Database
We connect to the database and query the presenting disorders table.
```python
db = ds.components[2]
db.connect("username", "password")
df = ds.query(table="presenting_disorders")
df[["subject", "session", "addiction"]].head()
```
This displays the first few rows of the queried table in a DataFrame format.
|
subject |
session |
addiction |
| 0 |
D0019 |
101 |
0 |
| 1 |
D0019 |
111 |
0 |
| 2 |
D0020 |
101 |
0 |
| 3 |
D0020 |
111 |
<NA> |
| 4 |
D0021 |
101 |
0 |
## Processing the EEG Data
We define functions to compute the mean EEG signal and retrieve the disorders.
```python
def get_eeg_mean(file):
raw = mne.io.read_raw_brainvision(file.path)
return raw.get_data().mean()
def get_disorders(file):
disorders = []
subject, session = file.tags["subject"], file.tags["session"]
filtered_df = df[(df["subject"] == subject) & (df["session"] == session)]
if filtered_df.empty:
print(subject, session)
return None
for column in ["addiction", "bipolar", "dementia", "ocd", "schizophrenia"]:
presence = filtered_df.iloc[0][column]
if not pd.isna(presence) and presence:
disorders.append(column)
return disorders if disorders else ["healthy"]
def file_func(file):
mean_eeg, disorders = get_eeg_mean(file), get_disorders(file)
if not disorders:
return pd.DataFrame()
mean_df = pd.DataFrame({"mean": [mean_eeg] * len(disorders), "disorder": disorders})
return mean_df.dropna()
```
We process the EEG header files to compute the mean EEG signal and retrieve the disorders.
```python
mean_dfs = list(map(file_func, eeg_header_files))
mean_dfs = [df for df in mean_dfs if not df.empty]
mean_df = pd.concat(mean_dfs, sort=False)
mean_df.head()
```
This displays the first few rows of the combined DataFrame.
|
mean |
disorder |
| 0 |
-0.008766 |
healthy |
| 1 |
0.000457 |
addiction |
| 2 |
-0.006335 |
healthy |
| 3 |
-0.002764 |
healthy |
| 4 |
-0.008269 |
ocd |
We compute the mean EEG signal for each disorder.
```python
mean_df.groupby("disorder").mean()
```
This displays the mean EEG signal for each disorder.
|
mean |
| disorder |
|
| addiction |
0.003414 |
| bipolar |
0.001613 |
| dementia |
0.010485 |
| healthy |
0.002449 |
| ocd |
-0.000875 |
| schizophrenia |
0.005444 |
## Visualizing the Results
We visualize the distribution of the mean EEG signal for each disorder using a violin plot.
```python
ax = sns.violinplot(data=mean_df, x="mean", hue="disorder")
sns.move_legend(ax, "upper left", bbox_to_anchor=(1, 1))
```
This generates the plot:

This concludes the tutorial. You've learned how different modalities
can be strung together to perform analysis involving multiple
modalities.