processing-eeg-with-mne.md 2.7 KB
Processing EEG with MNE-Python
import mne
import warnings
import numpy as np
import matplotlib.pyplot as plt

from almirah import Layout

mne.set_log_level(False)
warnings.filterwarnings('ignore')
lay = Layout(root="/path/to/data", specification_name="bids")
lay
<Layout root: '/path/to/data'>
lay = Layout.get(specification_name='bids')
files = lay.query(datatype="eeg", extension=".vhdr")
len(files)
2223
vhdr_file = lay.query(subject="D0019", session="101", datatype="eeg", task="rest", extension =".vhdr")[0]
eeg_file = lay.query(subject="D0019", session="101", datatype="eeg", task="rest", extension=".eeg")[0]
montage_file = lay.query(subject="D0019", session="101", space="CapTrak", suffix="electrodes")[0]

print(vhdr_file.rel_path)
sub-D0019/ses-101/eeg/sub-D0019_ses-101_task-rest_run-01_eeg.vhdr
eeg_file.download()
montage = mne.channels.read_custom_montage(montage_file.path)
raw = mne.io.read_raw_brainvision(vhdr_file.path, preload=True)
raw.set_montage(montage)
raw.info["bads"] = ["VREF"]

raw.info
General
Measurement date: Unknown
Experimenter: Unknown
Participant: Unknown
Channels
Digitized points: 132 points
Good channels: 128 EEG, 5 misc
Bad channels: VREF
EOG channels: Not available
ECG channels: Not available
Data
Sampling frequency: 1000.00 Hz
Highpass: 0.00 Hz
Lowpass: 500.00 Hz
Preprocessing
# Apply a band-pass filter
raw.filter(1, 40, fir_design="firwin")

# Plot the raw data
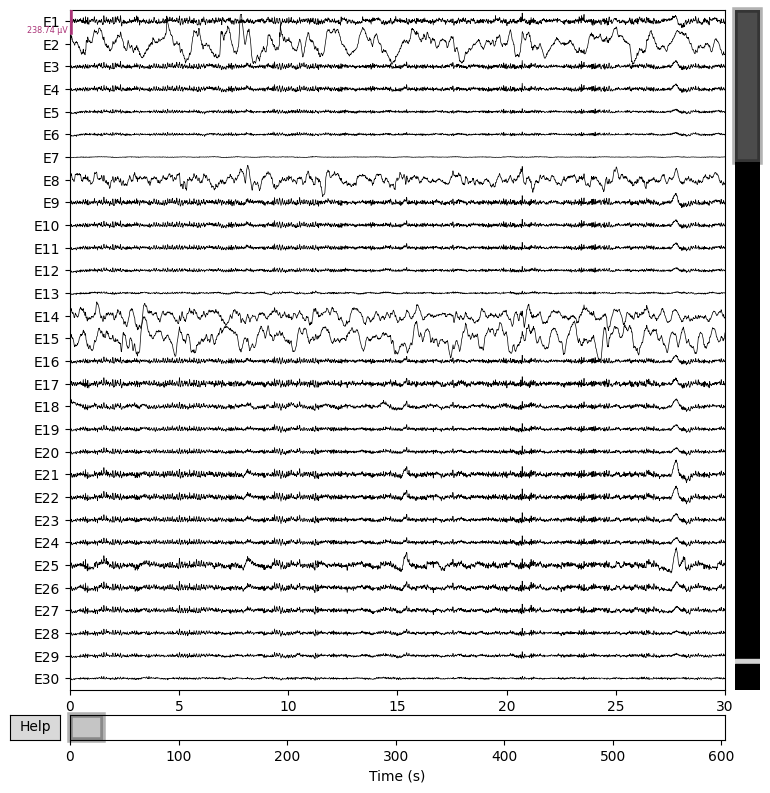
raw.plot(n_channels=30, duration=30, scalings="auto")
plt.close()
Artifact removal using ICA
# Setup ICA
ica = mne.preprocessing.ICA(n_components=15, random_state=97)
ica.fit(raw)

# Plot ICA components
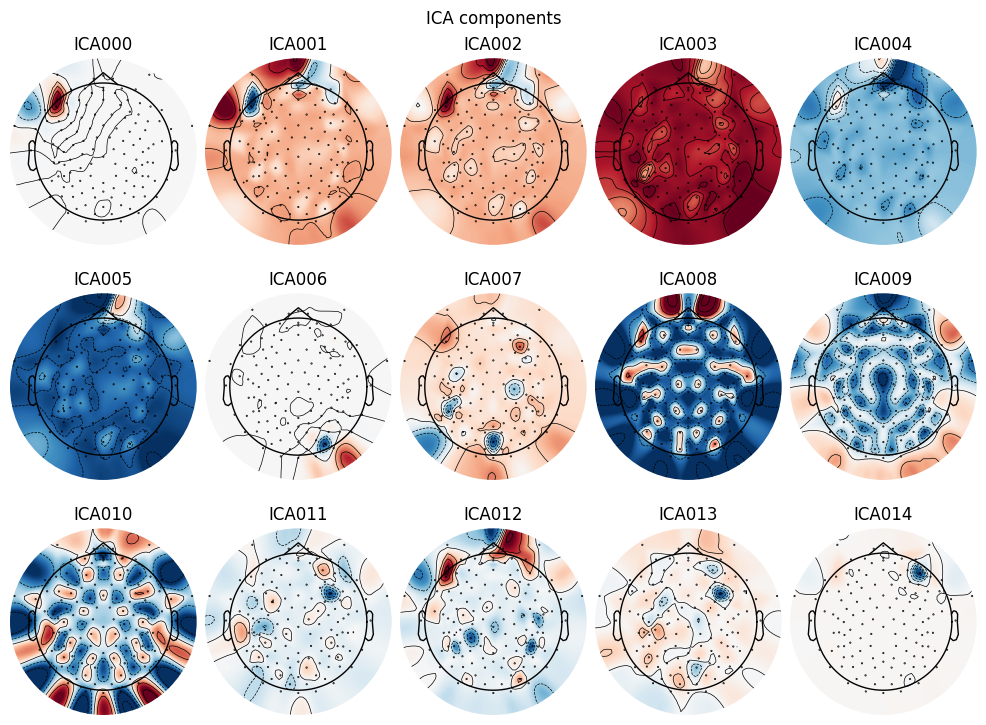
ica.plot_components()

# Select bad components manually (usually by visual inspection)
ica.exclude = [0, 6, 14]  # Example: components 0 and 1 are eye blinks and heartbeats

# Apply ICA removal
raw_clean = ica.apply(raw.copy())
Power Spectral Analysis
# Compute and plot Power Spectral Density (PSD)
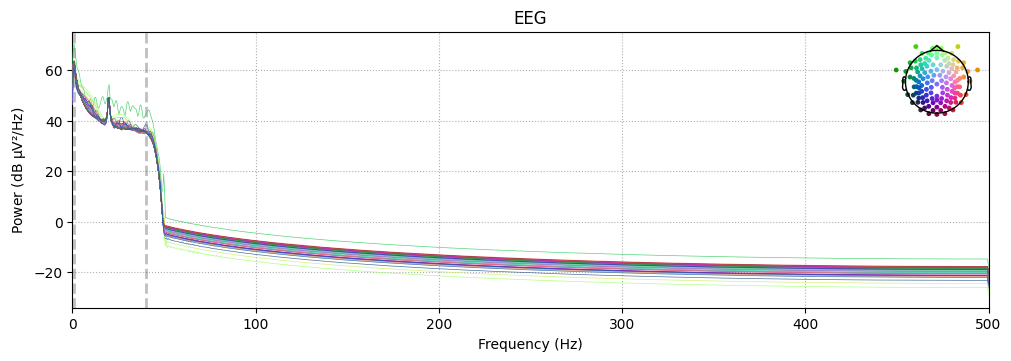
raw_clean.compute_psd().plot(exclude="bads", amplitude=False)
plt.show()
raw_clean.compute_psd().plot_topomap(ch_type="eeg", agg_fun=np.median)
plt.close()


