processing-nirs-with-mne.md 5.2 KB
Reading and processing NIRS data with MNE-Python
import mne
import warnings
import numpy as np
import matplotlib.pyplot as plt
from itertools import compress

from almirah import Layout

mne.set_log_level(False)
warnings.filterwarnings('ignore')
lay = Layout(root="/path/to/data", specification_name="bids")
print(lay)
<Layout root: '/path/to/data'>
files = lay.query(datatype="nirs", extension=".snirf")
len(files)
1315
file = lay.query(subject="D0019", task="rest", datatype="nirs", extension=".snirf")[0]
print(file.rel_path)
sub-D0019/ses-111/nirs/sub-D0019_ses-111_task-rest_run-01_nirs.snirf
file.download()
raw = mne.io.read_raw_snirf(file.path)
raw.load_data()
<summary><strong>General</strong></summary>
<table class="table table-hover table-striped table-sm table-responsive small">
    <tr>
        <th>Measurement date</th>
        <td>November 12, 1917  00:00:00 GMT</td>

    </tr>
    <tr>
        <th>Experimenter</th>
        <td>Unknown</td>

    </tr>
    <tr>
        <th>Participant</th>
        <td>mne_anonymize</td>
    </tr>
</table>
</details>
<details open>
    <summary><strong>Channels</strong></summary>
    <table class="table table-hover table-striped table-sm table-responsive small">
        <tr>
            <th>Digitized points</th>
            <td>21 points</td>
        </tr>
        <tr>
            <th>Good channels</th>
            <td>36 fNIRS (CW amplitude)</td>
        </tr>
        <tr>
            <th>Bad channels</th>
            <td>None</td>
        </tr>
        <tr>
            <th>EOG channels</th>
            <td>Not available</td>
        </tr>
        <tr>
            <th>ECG channels</th>
            <td>Not available</td>
        </tr>
    </table>
    </details>
    <details open>
        <summary><strong>Data</strong></summary>
        <table class="table table-hover table-striped table-sm table-responsive small">
            <tr>
                <th>Sampling frequency</th>
                <td>15.62 Hz</td>
            </tr>
            <tr>
                <th>Highpass</th>
                <td>0.00 Hz</td>
            </tr>
            <tr>
                <th>Lowpass</th>
                <td>7.81 Hz</td>
            </tr>
            <tr>
                <th>Filenames</th>
                <td>sub-D0019_ses-111_task-rest_run-01_nirs.snirf</td>
            </tr>
            <tr>
                <th>Duration</th>
                <td>00:10:03 (HH:MM:SS)</td>
            </tr>
        </table>
        </details>
print(raw.info)
<Info | 9 non-empty values
 bads: []
 ch_names: S1_D1 760, S1_D1 850, S1_D2 760, S1_D2 850, S2_D2 760, S2_D2 ...
 chs: 36 fNIRS (CW amplitude)
 custom_ref_applied: False
 dig: 21 items (3 Cardinal, 18 EEG)
 highpass: 0.0 Hz
 lowpass: 7.8 Hz
 meas_date: 1917-11-12 00:00:00 UTC
 nchan: 36
 projs: []
 sfreq: 15.6 Hz
 subject_info: 4 items (dict)
>
picks = mne.pick_types(raw.info, meg=False, fnirs=True)
dists = mne.preprocessing.nirs.source_detector_distances(raw.info, picks=picks)
raw.pick(picks[dists > 0.01])
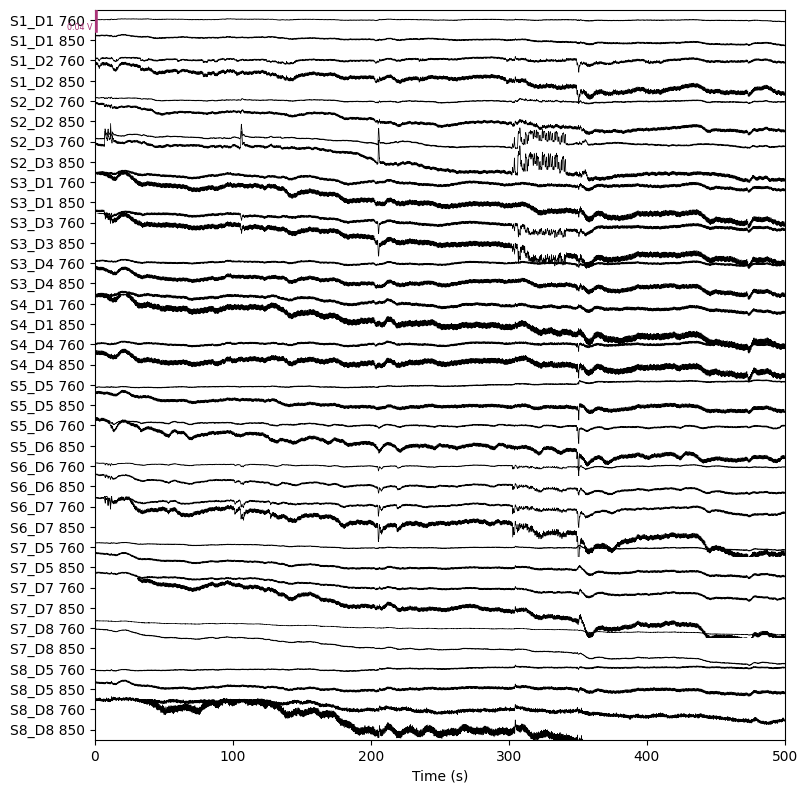
raw.plot(n_channels=len(raw.ch_names), duration=500, show_scrollbars=False)
plt.show()
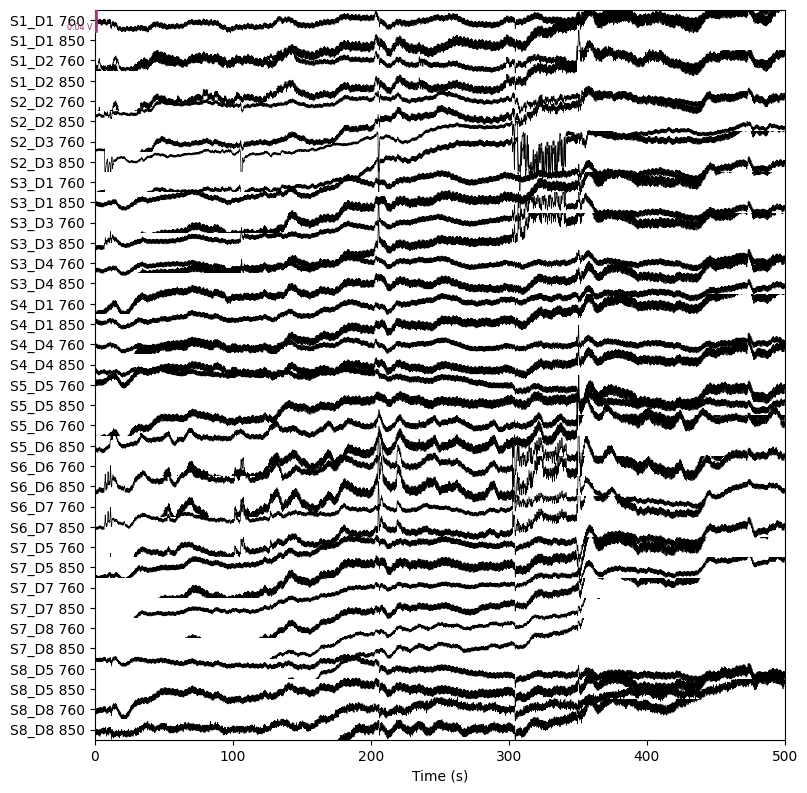
raw_od = mne.preprocessing.nirs.optical_density(raw)
raw_od.plot(n_channels=len(raw_od.ch_names), duration=500, show_scrollbars=False)
plt.show()
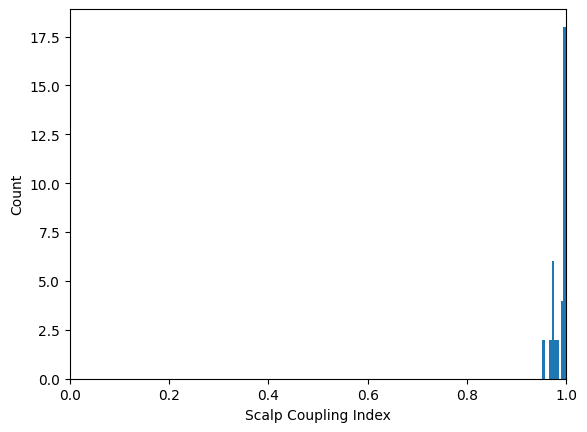
sci = mne.preprocessing.nirs.scalp_coupling_index(raw_od)
fig, ax = plt.subplots()
ax.hist(sci)
ax.set(xlabel="Scalp Coupling Index", ylabel="Count", xlim=[0, 1])
plt.show()
raw_od.info["bads"] = list(compress(raw_od.ch_names, sci < 0.5))
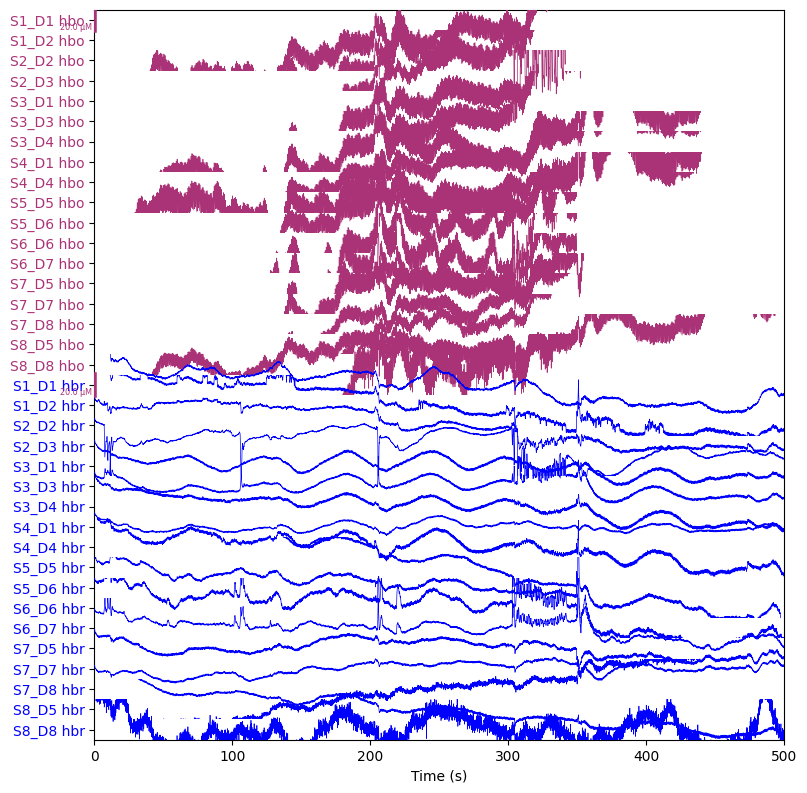
raw_haemo = mne.preprocessing.nirs.beer_lambert_law(raw_od, ppf=0.1)
raw_haemo.plot(n_channels=len(raw_haemo.ch_names), duration=500, show_scrollbars=False)
plt.show()
fig = raw_haemo.compute_psd().plot(average=True, amplitude=False)
fig.suptitle("Before filtering", weight="bold", size="x-large")
raw_haemo = raw_haemo.filter(0.05, 0.7, h_trans_bandwidth=0.2, l_trans_bandwidth=0.02)
fig = raw_haemo.compute_psd().plot(average=True)
fig.suptitle("After filtering", weight="bold", size="x-large")
plt.show()
epochs = mne.make_fixed_length_epochs(raw_haemo, duration=30, preload=False)
epochs.plot_image(combine="mean", vmin=-30, vmax=30,
                             ts_args=dict(ylim=dict(hbo=[-15, 15],
                                                    hbr=[-15, 15])))
plt.show()


