importing-eyetrack-with-mne.md 2.9 KB
Importing Eye tracking data with MNE-Python
This tutorial will guide you through the process of importing and
visualizing eye-tracking data using MNE-Python and almirah.
Setup
First, we'll import the necessary libraries and set the log level for MNE.
import mne
import matplotlib.pyplot as plt

from almirah import Layout

mne.set_log_level(False)
Loading the Data
Next, we'll set up the layout to access the eye-tracking data.
lay = Layout(root="/path/to/data", specification_name="bids")
lay
This should output:
<Layout root: '/path/to/data'>
We can query the layout to find all eye-tracking files with the .asc extension:
files = lay.query(datatype="eyetrack", extension=".asc")
len(files)
This gives the total number of eye-tracking files:
3632
Querying a Specific File
To query a specific file, we can filter by subject, datatype, task, and extension:
file = lay.query(subject="D0019", datatype="eyetrack", task="FIX", extension=".asc")[0]

print(file.rel_path)
This should output the relative path of the file:
sub-D0019/ses-111/eyetrack/sub-D0019_ses-111_task-FIX_run-01_eyetrack.asc
Reading and Plotting the Data
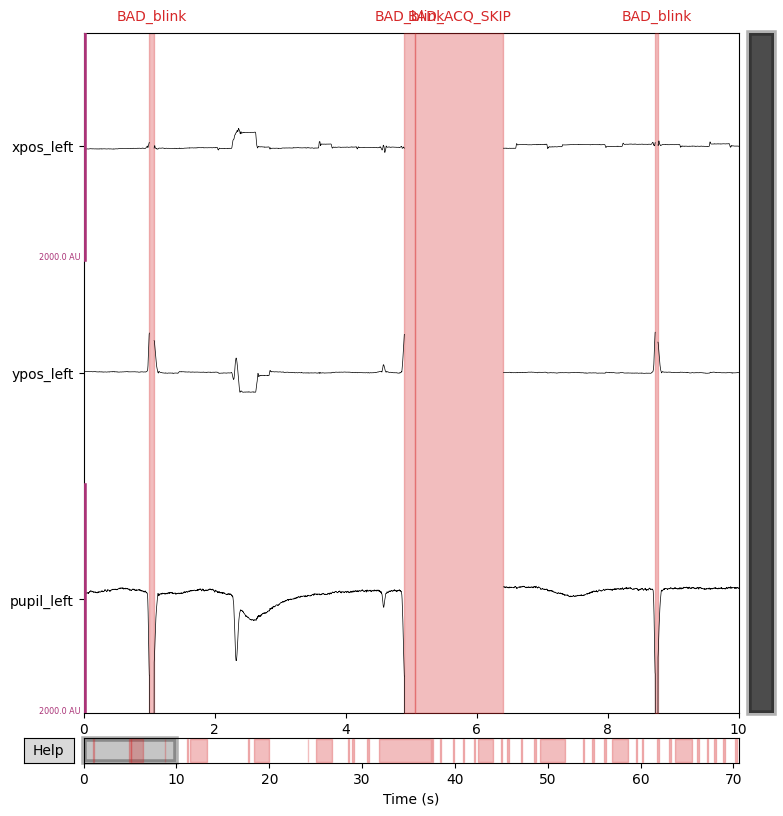
We use MNE to read the eye-tracking data file and create annotations for blinks:
raw = mne.io.read_raw_eyelink(file.path, create_annotations=["blinks"])
custom_scalings = dict(eyegaze=1e3)
raw.pick(picks="eyetrack").plot(scalings=custom_scalings)
plt.close()
Inspecting the Data
We can inspect the metadata and channels in the raw object:
raw
General
Measurement date: January 01, 2009 00:03:33 GMT
Experimenter: Unknown
Participant: Unknown
Channels
Digitized points: Not available
Good channels: 2 Eye-tracking (Gaze position), 1 Eye-tracking (Pupil size)
Bad channels: None
EOG channels: Not available
ECG channels: Not available
Data
Sampling frequency: 1000.00 Hz
Highpass: 0.00 Hz
Lowpass: 500.00 Hz
Filenames: sub-D0019_ses-111_task-FIX_run-01_eyetrack.asc
Duration: 00:01:11 (HH:MM:SS)
We can also list the channel names:
raw.ch_names
This should output:
['xpos_left', 'ypos_left', 'pupil_left']
And inspect the data for a specific channel, such as xpos_left:
raw["xpos_left"]
This gives the data array and the corresponding time points:
(array([[510.2, 510.1, 509.9, ..., 454.4, 454.8, 455.5]]),
 array([0.0000e+00, 1.0000e-03, 2.0000e-03, ..., 7.0556e+01, 7.0557e+01,
        7.0558e+01]))
This concludes the tutorial. You've learned how to import, query, and
visualize eye-tracking data using MNE-Python and almirah.
